A few years ago, I took a look at the data on homelessness in the United States. We now have new data (and a new reality) so let’s revisit things, this time in superior list format.
1. After holding steady for years, homelessness recently jumped up a bit.
Here is the percentage of the population that was homeless between 2011 and 2023 (the last year we have data for):

There was a clear uptick after 2022. But this just brought things back to where they stood in 2011, which hardly seems like cause to panic.
To calibrate, here’s a comparison to some other rich countries:
| Country | Living rough | Temp shelter | Total |
|---|---|---|---|
| Australia | 0.030% | 0.095% | 0.125% |
| Canada | 0.025% | 0.085% | 0.110% |
| England | 0.016% | 0.406% | 0.422% |
| France | 0.008% | 0.465% | 0.473% |
| Germany | 0.045% | 0.210% | 0.256% |
| Italy | - | - | 0.160% |
| Japan | 0.002% | - | - |
| Switzerland | - | - | 0.040% |
| United States | 0.075% | 0.115% | 0.190% |
All these numbers are the most recent data collected by the OECD. Take these numbers with a grain of salt—each country uses different methodology. I suspect this is particularly true for the “temp shelter” numbers (and thus also the totals). This suggests the United States is indeed on on the higher end.
Do things look more crisis-y if we look at certain states or cities? Or is the “type” of homelessness perhaps getting worse, with fewer people staying in a shelter for a few weeks while they find a new job, and more mentally ill people lingering for years on the streets?
2. It’s not noise.
First though, you might ask if the increase at the end of the above graph is real. Where are the error bars? The answer—at least in principle—is that there are no error bars, because we aren’t using an estimate of the number of homeless. It’s a full count.
Let’s back up. Every year in January, the US counts its homeless. Roughly speaking, how this works is that the Department of Housing and Urban Development (HUD) tells hundreds of nonprofits and local government organizations across the country:
You there! Some night during the last 10 days of January, you must count every single homeless person in your area. If you don’t, then you don’t get any more money. How you accomplish this is your problem. Have fun!
HUD publishes the data and some vizualizations, but their $72 billion budget doesn’t provide for visualizations that are very good, so fine—I’ll do it.
3. Homelessness is much higher in some places.
Here’s the percentage of the population in each state that was homeless in January 2023. (The January 2024 count has already been done, but it takes HUD 11 months to publish the data.)

Those are percentages. So in Mississippi, 0.033% of people homeless, or 1 in 3300 is homeless. In New York, it’s 0.527% or 1 in 190.
4. Homelessness is increasing in some states, near constant in others, and decreasing almost nowhere.
When you talk about a crisis, theres an implication that things are getting worse. (You don’t hear much about the everyone you love will die and be forgotten “crisis”…) So here’s the change between 2020 and 2023, again as a percentage of each state’s population.

Broadly speaking, things are increasing in the West and Northeast and constant elsewhere. For example, in California, homelessness increased by 0.057%, or around 1 extra homeless person per 1750 people.
5. The biggest per-capita increase by far was in… Vermont?
Vermont increased by 0.336%. That increase alone is 2-3× the total homelessness rate in most states.
To be clear, the previous map is the change in homelessness as a percentage of the total state population. So this isn’t some artifact of having a small increase relative to an even smaller starting rate.
Some people seem to blame the increase on people moving to Vermont during Covid and causing increases in property values and/or the total number of people. Now, I’m dividing the homeless counts for each state/year by the census’ per-year/per-state population estimates. That should control for increases in total population, but I haven’t really checked how accurate those estimates are.
My best guess is that it’s one of those “law of small numbers” things like how the countries with the highest rates of anything are always small countries: Vermont is tiny both in area and population (around 600k) so if something happens in one region, there isn’t some other unaffected region to average it out with. We’ll drill down to cities rather than states later.
6. There are different types of homelessness.
One person might run out of money, get evicted, stay in a shelter for a few weeks, and then eventually move in with family and get back on their feet. Another person might have mental health issues and linger on the street for years. If we want to understand things, we should try to distinguish which of these things is happening.
We’ll start on this by looking at two attributes that HUD collects.
The first is if someone is sheltered or unsheltered. Someone is sheltered if staying in an emergency shelter, transitional housing program, or a safe haven. They’re unsheltered if staying in a vehicle, an abandoned building, or on the street.
The second is if someone is chronically or non-chronically homeless. Roughly speaking, someone is chronically homeless if they’ve been homeless for at least a year.
7. HUD’s formal definition of “chronically homeless” is ludicrously complex.
Technically speaking, according to their instructions, someone qualifies as “chronically homeless” if (a) they’ve been homeless for a total of at least one year in the last three years, (b) that homelessness happened in at least four separate episodes; and (c) those four episodes were separated by at least a week.
So someone who is 40 years old and has spent their entire life on the street except for Jan 1-6 of each year: Non-chronically homeless? Trying to apply this definition to everyone on a single night every year must be lots of fun.
8. Most homeless people are sheltered and non-chronic.
Here is the breakdown at a national level:
| Non-chronic | Chronic | Total | |
|---|---|---|---|
| Sheltered | 51.9% | 8.9% | 60.8% |
| Unsheltered | 24.4% | 14.8% | 39.2% |
| Total | 76.3% | 23.7% | 100% |
How I think about this is:
- The homeless are mostly non-chronic (around 3/4).
- The non-chronic homeless are mostly sheltered (around 2/3).
- The chronic homeless are mostly unsheltered (around 2/3).
Fine. But how has this changed over time. And how does it vary from place to place?
9. All types of homelessness have increased.
Until 2022, overall homelessness was holding steady, but getting “worse”—decreases in the “best” type of homelessness (sheltered non-chronic) were being offset by increases in the other “worse” kinds. But in 2023, all types increased.

10. Different states have different types of homelessness.
Let’s compare New York and California.


Though the overall homelessness rate is roughly similar in both places, California has much more unsheltered and chronic homelessness.
11. Sheltered non-chronic homelessness is highest in the Northeast. Unsheltered and chronic homelessness is concentrated in the West.
Here are maps for the percentage of each state’s population in each of the four states of homelessness.
 |
 |
 |
 |
The magnitudes vary by a lot. Sheltered non-chronic homeless make up 1 out of 5900 people in Mississippi but 1 out of 210 in New York. Unsheltered chronic homeless make up in 1 in 7000 in Minnesota but 1 in 936 in California.
When looking at these maps, let me remind you that this data is collected in January when it is cold in New York and stupidly cold in Minnesota. You have to imagine things would look quite different if data was collected in summer.
12. Sheltered non-chronic homelessness is increasing in the Northeast. Other types are increasing in the West.
Here is the change in each type of homelessness in each state between 2020 and 2023, where gray indicates a (rare) decrease, and a color indicates an increase.
 |
 |
 |
 |
To summarize:
- Almost no states have declines in any type of homelessness.
- The Northeast has increases in sheltered non-chronic homelessness.
- Most states in the West have increases in unsheltered and/or chronic homelessness.
For even more detail, we can plot things for individual states year by year.
13. New York has recently had a huge spike in sheltered non-chronic homelessness.

After a decline from 2019 to 2022, there was a huge increase in 2023, presumably driven by the arrival of hundreds of thousands of foreign migrants.
Aside: Did you know that there is a constitutional right to shelter in New York? This is a result of a 1979 New York State Supreme Court decision. (This has recently been scaled back to 30 days.) Massachusetts also has a mandate from a 1983 law but only for families. The District of Columbia guarantees shelter to families, and to individuals when the temperature is below 32° F or above 95 °F (below 0° C or above 35 °C).
14. Increases in California are driven by unsheltered chronic homelessness.

15. Florida’s long decline seems to have ended.

After a long slow decrease, there was a small a recent increase. But of course, rates remain low.
16. HUD provides data on mental health, but it doesn’t make things easy.
Sheltered-ness and chronic-ness is one way to look into homelessness. But what about meth? What about mental illness? Many people believe these are a big part of the homelessness crisis.
Well, HUD does collect data on if people are “severely mentally ill” or suffer from “chronic substance abuse”. I can’t figure out exactly how these are defined. It’s implied that it’s done by literally asking people, but it’s also implied that it varies from place to place.
Anyway, though HUD collects these numbers, they don’t publish the data. However, they do publish reports, both for the entire nation, for individual states and for different local areas.
So I did the sensible thing. I downloaded 7372 different .pdf files, wrote a script to convert each .pdf to plain text, wrote a parser for that text, compensated for 8 billion infuriating inconsistencies in how they do all the reports, damn you HUD, damn you to hell, extracted the data on substance abuse and mental illness, and made plots.
17. Nationally, there is a clear uptick in unsheltered homelessness with mental illness and/or substance abuse.

Blue is people with mental health issues, while orange is people with substance abuse. These are overlapping groups, although it’s not clear how overlapping. (My guess is it’s a lot.) Grey is all homeless people, including those without mental or substance abuse issues.
Take a look at the orange/blue lines in the bottom right of the above graph. This is a small fraction of the homeless population, but looms large as they tend to be more visible/disruptive. They’ve grown at quite a rapid rate since 2018 or so.
18. Things are even more pronounced in the West.
Here’s California:

That’s tens of thousands of extra unsheltered people with substance abuse issues since the minimum in 2018.
Washington state is even more stark:

19. But the pattern doesn’t hold in the Northeast.
Look at New York:

Or look at Massachusetts:

It makes sense that almost no one is unsheltered—it’s just too cold in these places in January. But then why don’t these states have increasing mental illness and substance abuse issues like the West? Is it because the cold forces people into shelters, and therefore more contact with supportive services? Highly unsure.
20. California is kind of confusing.
Here is the change over time in LA:
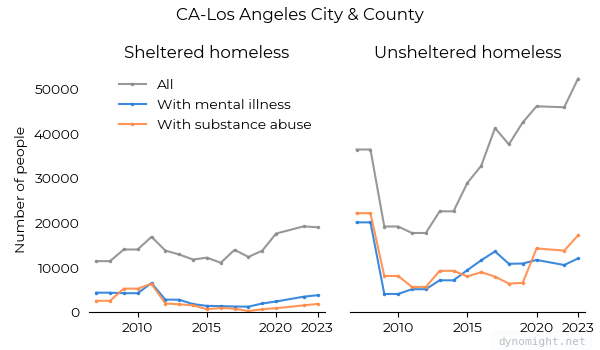
This fits with the previous narrative. But here’s San Francisco, the single place most identified with homelessness in the American imagination:

Huh?
Note: I also made hundreds more plots with details for all states / cities / regions, which you can view by clicking the little trangles below. I know the tiny little triangles don’t look very promising, but I assure you, the plots are there.
(Click here for detailed plots for all 50 states.)
Alabama


Alaska


Arizona


Arkansas


California
Colorado


Connecticut


Delaware


Florida


Georgia


Hawaii


Idaho


Illinois


Indiana


Iowa


Kansas


Kentucky


Louisiana


Maine


Maryland


Massachusetts


Michigan


Minnesota


Mississippi


Missouri


Montana


Nebraska


Nevada


New Hampshire


New Jersey


New Mexico


New York


North Carolina


North Dakota


Ohio


Oklahoma


Oregon


Pennsylvania


Rhode Island


South Carolina


South Dakota


Tennessee


Texas


Utah


Vermont


Virginia


Washington


West Virginia


Wisconsin


Wyoming


(Click here for detailed plots for local cities / regions.)
AK
Alaska Balance of State

Anchorage

AL
Alabama Balance of State

Birmingham Jefferson, St. Clair, Shelby Counties

Florence Northwest Alabama

Gadsden Northeast Alabama

Huntsville North Alabama

Mobile City & County Baldwin County

Montgomery City & County

Tuscaloosa City & County

AR
Arkansas Balance of State

Fayetteville Northwest Arkansas

Little Rock Central Arkansas

Southeast Arkansas

AZ
Arizona Balance of State

Phoenix, Mesa Maricopa County

Tucson Pima County

CA
Alpine, Inyo, Mono Counties

Amador, Calaveras, Mariposa, Tuolumne Counties

Bakersfield Kern County

Chico, Paradise Butte County

Colusa, Glenn, Trinity Counties

Daly City San Mateo County

Davis, Woodland Yolo County

El Dorado County

Fresno City & County Madera County

Glendale

Humboldt County

Imperial County

Lake County

Long Beach

Los Angeles City & County

Marin County

Mendocino County

Merced City & County

Napa City & County

Nevada County

Oakland, Berkeley Alameda County

Oxnard, San Buenaventura Ventura County

Pasadena

Redding Shasta, Siskiyou, Lassen, Plumas, Del Norte, Modoc, Sierra Counties

Richmond Contra Costa County

Riverside City & County

Roseville, Rocklin Placer County

Sacramento City & County

Salinas Monterey, San Benito Counties

San Bernardino City & County

San Diego City and County

San Francisco

San Jose Santa Clara City & County

San Luis Obispo County

Santa Ana, Anaheim Orange County

Santa Maria Santa Barbara County

Santa Rosa, Petaluma Sonoma County

Stockton San Joaquin County

Tehama County

Turlock, Modesto Stanislaus County

Vallejo Solano County

Visalia Kings, Tulare Counties

Watsonville Santa Cruz City & County

Yuba City & County Sutter County

CO
Colorado Balance of State

Colorado Springs El Paso County

Fort Collins, Greeley, Loveland Larimer, Weld Counties

Metropolitan Denver

CT
Bridgeport, Stamford, Norwalk, Danbury Fairfield County

Connecticut Balance of State

DC
District of Columbia

DE
Delaware Statewide

FL
Charlotte County

Citrus, Hernando, Lake, Sumter Counties

Columbia, Hamilton, Lafayette, Suwannee Counties

Deltona, Daytona Beach Volusia, Flagler Counties

Fort Pierce St. Lucie, Indian River, Martin Counties

Fort Walton Beach Okaloosa, Walton Counties

Ft Lauderdale Broward County

Ft Myers, Cape Coral Lee County

Gainesville Alachua, Putnam Counties

Hendry, Hardee, Highlands Counties

Jacksonville-Duval, Clay Counties

Lakeland, Winterhaven Polk County

Miami-Dade County

Monroe County

Naples Collier County

Ocala Marion County

Orlando Orange, Osceola, Seminole Counties

Palm Bay, Melbourne Brevard County

Panama City Bay, Jackson Counties

Pasco County

Pensacola Escambia, Santa Rosa Counties

Sarasota, Bradenton Manatee, Sarasota Counties

St. Johns County

St. Petersburg, Clearwater, Largo Pinellas County
Tallahassee Leon County

Tampa Hillsborough County

West Palm Beach Palm Beach County

GA
Athens-Clarke County

Atlanta

Augusta-Richmond County

Columbus-Muscogee

DeKalb County

Fulton County

Georgia Balance of State

Marietta Cobb County

Savannah Chatham County

GU
Guam

HI
Hawaii Balance of State

Honolulu City and County

IA
Des Moines Polk County

Iowa Balance of State

Sioux City Dakota, Woodbury Counties

ID
Boise Ada County

Idaho Balance of State

IL
Aurora, Elgin Kane County

Bloomington Central Illinois

Champaign, Urbana, Rantoul Champaign County

Chicago

Cook County

Decatur Macon County

DuPage County

East St. Louis, Belleville St. Clair County

Joliet, Bolingbrook Will County

Madison County

McHenry County

Peoria, Pekin Fulton, Tazewell, Peoria, Woodford Counties

Rock Island, Moline Northwestern Illinois

Rockford DeKalb, Winnebago, Boone Counties

South Central Illinois

Southern Illinois

Springfield Sangamon County

Waukegan, North Chicago Lake County

West Central Illinois

IN
Indiana Balance of State

Indianapolis

KS
Kansas Balance of State

Overland Park, Shawnee Johnson County

Topeka Shawnee County

Wichita Sedgwick County

KY
Kentucky Balance of State

Lexington-Fayette County

Louisville-Jefferson County

LA
Alexandria Central Louisiana

Lafayette Acadiana Regional

Louisiana Balance of State

Monroe Northeast Louisiana

New Orleans Jefferson Parish

Shreveport, Bossier Northwest Louisiana

Slidell Southeast Louisiana

MA
Attleboro, Taunton Bristol County

Boston

Cambridge

Cape Cod Islands

Fall River

Gloucester, Haverhill, Salem Essex County

Lynn

Massachusetts Balance of State

New Bedford

Pittsfield Berkshire, Franklin, Hampshire Counties

Quincy, Brockton, Weymouth, Plymouth City and County

Springfield Hampden County

Worcester City & County

MD
Annapolis Anne Arundel County

Baltimore

Baltimore County

Carroll County

Frederick City & County

Harford County

Howard County

Mid-Shore Regional

Montgomery County

Prince George's County

Wicomico, Somerset, Worcester Counties

ME
Maine Statewide

MI
Battle Creek Calhoun County

Dearborn, Dearborn Heights, Westland Wayne County

Detroit

Eaton County

Flint Genesee County

Grand Rapids, Wyoming Kent County

Grand Traverse, Antrim, Leelanau Counties

Holland Ottawa County

Jackson City & County

Lansing, East Lansing Ingham County

Lenawee County

Livingston County

Michigan Balance of State

Monroe City & County

Norton Shores, Muskegon City & County

Pontiac, Royal Oak Oakland County

Portage, Kalamazoo City & County

Saginaw City & County

St. Clair Shores, Warren Macomb County

Washtenaw County

MN
Dakota, Anoka, Washington, Scott, Carver Counties

Duluth St. Louis County

Minneapolis Hennepin County

Moorhead West Central Minnesota

Northeast Minnesota

Northwest Minnesota

Rochester Southeast Minnesota

Southwest Minnesota

St. Cloud Central Minnesota

St. Paul Ramsey County

MO
Joplin Jasper, Newton Counties

Missouri Balance of State

Springfield Greene, Christian, Webster Counties

St. Charles City & County, Lincoln, Warren Counties

St. Joseph Andrew, Buchanan, DeKalb Counties

St. Louis City

St. Louis County

MP
Northern Mariana Islands

MS
Gulf Port Gulf Coast Regional

Jackson Rankin, Madison Counties

Mississippi Balance of State

MT
Montana Statewide

NC
Asheville Buncombe County

Chapel Hill Orange County

Charlotte Mecklenburg County

Durham City & County

Fayetteville Cumberland County

Gastonia Cleveland, Gaston, Lincoln Counties

Greensboro, High Point

North Carolina Balance of State

Northwest North Carolina

Raleigh Wake County

Wilmington Brunswick, New Hanover, Pender Counties

Winston-Salem Forsyth County

ND
North Dakota Statewide

NE
Lincoln

Nebraska Balance of State

Omaha, Council Bluffs

NH
Manchester

Nashua Hillsborough County

New Hampshire Balance of State

NJ
Atlantic City & County

Bergen County

Burlington County

Camden City & County Gloucester, Cape May, Cumberland Counties

Elizabeth Union County

Jersey City, Bayonne Hudson County

Lakewood Township Ocean County

Monmouth County

Morris County

New Brunswick Middlesex County

Newark Essex County

Paterson Passaic County

Salem County

Somerset County

Trenton Mercer County

Warren, Sussex, Hunterdon Counties

NM
Albuquerque

New Mexico Balance of State

NV
Las Vegas Clark County

Nevada Balance of State

Reno, Sparks Washoe County

NY
Albany City & County

Binghamton, Union Town Broome, Otsego, Chenango, Delaware, Cortland, Tioga Counties

Buffalo, Niagara Falls Erie, Niagara, Orleans, Genesee, Wyoming Counties

Columbia, Greene Counties

Elmira Steuben, Allegany, Livingston, Chemung, Schuyler Counties

Franklin, Essex Counties

Glens Falls, Saratoga Springs Saratoga, Washington, Warren, Hamilton Counties

Ithaca Tompkins County

Jamestown, Dunkirk Chautauqua County

Jefferson, Lewis, St. Lawrence Counties

Kingston Ulster County

Nassau, Suffolk Counties

New York Balance of State

New York City

Newburgh, Middletown Orange County

Poughkeepsie Dutchess County

Rochester, Irondequoit, Greece Monroe County

Rockland County

Schenectady City & County

Syracuse, Auburn Onondaga, Oswego, Cayuga Counties

Troy Rensselaer County

Utica, Rome Oneida, Madison Counties

Wayne, Ontario, Seneca, Yates Counties

Yonkers, Mount Vernon Westchester County

OH
Akron, Barberton Summit County

Canton, Massillon, Alliance Stark County

Cincinnati Hamilton County

Cleveland Cuyahoga County

Columbus Franklin County

Dayton, Kettering Montgomery County

Ohio Balance of State

Toledo Lucas County

Youngstown Mahoning County

OK
Norman Cleveland County

North Central Oklahoma

Northeast Oklahoma

Oklahoma Balance of State

Oklahoma City

Southeastern Oklahoma Regional

Southwest Oklahoma Regional

Tulsa City & County

OR
Central Oregon

Clackamas County

Eugene, Springfield Lane County

Hillsboro, Beaverton Washington County

Medford, Ashland Jackson County

Oregon Balance of State

Portland, Gresham Multnomah County

Salem Marion, Polk Counties

PA
Beaver County

Bristol, Bensalem Bucks County

Chester County

Eastern Pennsylvania

Erie City & County

Harrisburg Dauphin County

Lancaster City & County

Lower Merion, Norristown, Abington Montgomery County

Philadelphia

Pittsburgh, McKeesport, Penn Hills Allegheny County

Reading Berks County

Scranton Lackawanna County

Upper Darby, Chester, Haverford Delaware County

Western Pennsylvania

Wilkes-Barre, Hazleton Luzerne County

York City & County

PR
Puerto Rico Balance of Commonwealth

South-Southeast Puerto Rico

RI
Rhode Island Statewide

SC
Charleston Low Country

Columbia Midlands

Greenville, Anderson, Spartanburg Upstate

Sumter City & County

SD
South Dakota Statewide

TN
Appalachian Regional

Central Tennessee

Chattanooga Southeast Tennessee

Jackson West Tennessee

Knoxville Knox County

Memphis Shelby County

Morristown Blount, Sevier, Campbell, Cocke Counties

Murfreesboro Rutherford County

Nashville-Davidson County

Upper Cumberland

TX
Amarillo

Austin Travis County

Bryan, College Station Brazos Valley

Dallas City & County, Irving

El Paso City & County

Fort Worth, Arlington Tarrant County

Houston, Pasadena, Conroe Harris, Fort Bend, Montgomery Counties

San Antonio Bexar County

Texas Balance of State

Waco McLennan County

Wichita Falls Wise, Palo Pinto, Wichita, Archer Counties

UT
Provo Mountainland

Salt Lake City & County

Utah Balance of State

VA
Alexandria

Arlington County

Charlottesville

Fairfax County

Fredericksburg Spotsylvania, Stafford Counties

Harrisonburg, Winchester Western Virginia

Loudoun County

Lynchburg

Newport News, Hampton Virginia Peninsula

Norfolk, Chesapeake, Suffolk Isle of Wight, Southampton Counties

Portsmouth

Prince William County

Richmond Henrico, Chesterfield, Hanover Counties

Roanoke City & County, Salem

Virginia Balance of State

Virginia Beach

VI
Virgin Islands

VT
Burlington Chittenden County

Vermont Balance of State

WA
Everett Snohomish County

Seattle King County

Spokane City & County

Tacoma, Lakewood Pierce County

Vancouver Clark County

Washington Balance of State

WI
Madison Dane County

Milwaukee City & County

Racine City & County

Wisconsin Balance of State

WV
Charleston Kanawha, Putnam, Boone, Clay Counties

Huntington Cabell, Wayne Counties

West Virginia Balance of State

Wheeling, Weirton Area

WY
Wyoming Statewide