What do you worry about more: Getting exercise, eating vegetables, or the air you breathe?
While most things that clearly improve health are well known, one is insanely underrated: Fixing your air. I suspect this is often the most effective health intervention, period. Nothing else is so important while also being so easy to address.
Let’s do a sanity check: Take the four biggest countries in the world and compare how many people died from various causes in 2019.
It’s hard to prioritize health advice. I’m told I should limit salt and eat cruciferous vegetables and do cardio and sleep well and limit alcohol and reduce stress and go for regular checkups. But how much do each of these matter? If you’re a fallible hairless ape, what should you do first?
To answer this, we need numbers. Below, I’ve estimated how much various things impact life through air quality.
| Lifestyle | Life cost |
|---|---|
| Be a Viking | 4 years |
| Live in Delhi | 3 years |
| Commute by train from Newark to NYC | ½ year |
| Live in an average part of US | ¼ year |
| Breathe second-hand vape smoke | near zero? |
| Single Event | Life cost |
|---|---|
| Live near 2020 US west-coast wildfires | 2.4 days |
| Have a really smoky fire at home | 2 days |
| Burn a cone of incense | 2.3 hours |
| Use an ultrasonic humidifier for one night | 50 min? |
| Broil fish with windows closed | 45 min |
| Burn a stick of incense | 27 min |
| Use hairspray | 14 min |
| Smoke one cigarette | 11 min |
| Blow out a candle before sleep | 10 min |
This is good news—you can buy extra life with minimal cost in money, time, effort, or willpower!
By all means, control your body-mass, eat well, and start running. Those are important, but they’re also kind of hard. You might fail to lose weight, but if you try to fix your air, you’ll succeed. You should put the stuff with the highest return on effort first, and that’s air.
What I recommend
If you don’t want to read this long, looooooong article (I’m sorry) just do these things in this order:
- If you have an ultrasonic humidifier, kill it.
- Monitor local air quality like the weather.
- No incense.
- Extinguish candles with a lid.
- Be careful about smoke when cooking.
- Get a particle counter.
- Use an air purifier at home all the time. (Move this to #1 if the outdoor air has high particulate levels where you live.)
- Install a HEPA cabin air filter in your car.
- Avoid aerosols.
- Use a mask very carefully when in dirty air.
A strange list, admittedly, but it’s where the evidence seems to lead.
Particles and the trouble they cause
What we’re measuring
We measure particles in terms of PM2.5. To understand what these numbers mean, here’s how you could, in theory, measure them:
- Take a cubic meter of air.
- Filter out all of the solid particles.
- Keep only the particles that are 2.5 microns (μm) or smaller.
- Weigh the remaining particles in micrograms (μg).
The units are μg/m³, since you’re weighing particles (in μg) in one m³ of air.
For reference, human hair is around 70 microns wide, bacteria are 1 to 10 and viruses are 0.02 to 0.4. The EPA gives a helpful visualization:
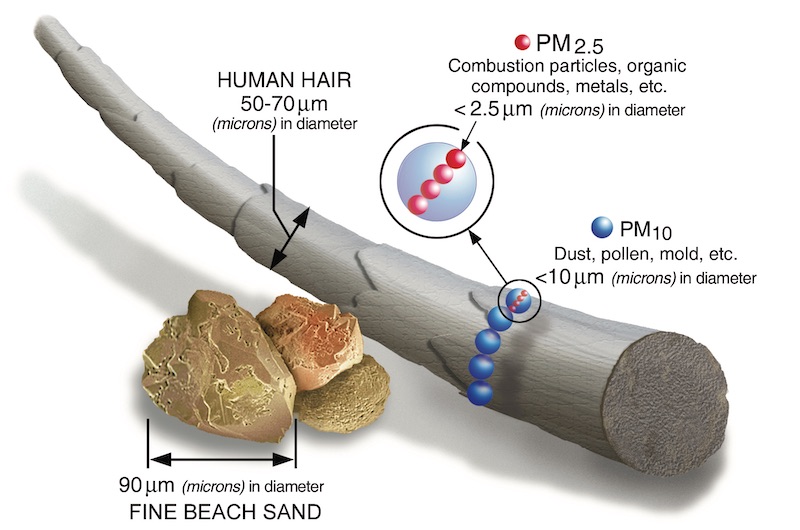
You might ask: Does it matter what the actual particles are? Is 50 μg/m³ created by burning coal or manufacturing cement or natural dust equally harmful? The answer is no (heard of asbestos?) but we don’t really know how much these differences matter in practice.
Quantifying harms
A better measure than deaths is disability-adjusted life years or DALYs. This is the number of years of life lost plus an adjustment for non-lethal conditions that make life worse. For example, schizophrenia is pretty bad, so this measure counts someone who becomes schizophrenic for a year as losing half a DALY. Looking at DALYs lost to different causes gives a similar picture to deaths:
These numbers are only for ambient air pollution, e.g., due to cars, power plants, and manufacturing. Indoor air pollution comes on top of this.
How particles hurt you
We worry about tiny particles because they seem most harmful, particularly in terms of how chronic exposure leads to long-term health problems.
Tiny particles do cause lung cancer, but that’s one of the smaller harms. More than half of harms don’t come from the lungs at all, but from diabetes and cardiovascular disease. Here are the DALYs lost in the US in 2019:
How particles manage to do all this is still a subject of research. The basic story seems to be that tiny particles easily get through the lungs into the bloodstream. These foreign particles then activate your immune system, which sort of goes on a rampage, causing tons of problems.
Why so much cardiovascular disease? Well, you can probably guess where the blood goes after it leaves the lungs.
A heuristic to quantify harms
How much do particles hurt you? While it’s hard to be precise, this section will give two simple heuristics:
- A life-long exposure of 33.3 PM2.5 costs 1 DALY. This is best for lifestyle changes. For example, moving from somewhere with no particulates to somewhere with a level of 100 costs 3 DALY.
- At 2500 PM2.5, you lose disability-adjusted life in real time. This is best for one-off events. For example, if you’re exposed to a level of 5000 for 3 hours, you lose 6 disability-adjusted life hours.
Of course, the only way to be sure would be to do randomized experiments where we lock people inside identical environments for their whole lives, vary the particulates they’re exposed to, and see how long they live. Since we can’t do that, we’re left with observational studies.
A 2013 paper looked at life expectancies and particle levels in 545 US counties, while controlling for confounding variables like wealth, smoking, and demographics. They found that each 28.5 μg/m³ of particulates costs 1 year (not disability-adjusted.)
Should we trust this number? Most papers focus on public-health questions, but we can extract estimates. A comprehensive 2017 paper estimates the population mean PM2.5 in different countries, as well as the health costs of ambient air particles. I took their estimates and multiplied them by the WHO’s life expectancy figures to get an estimate of the total DALYs a person loses over a lifetime. Here we compare these to particle levels.
The straight line shows a fit. It suggests that if you are exposed to 33.3 PM2.5 for your whole life, you’ll lose around 1 DALY as a result. I wouldn’t put too much faith in this exact number. It varies from country to country, and this is all built upon some very tricky observational statistics. Still, the estimate is reassuringly close the the number from the 2013 paper.
You might ask: Shouldn’t the same level of particles cause more harm somewhere where people live longer since they have more time to spend breathing?
Maybe. I tried relating the particles to the DALY loss in a single year, without multiplying by life expectancy. It suggests that being exposed to 2500 PM2.5 for one year costs 1 DALY.
Put another way, if you breathe particles at a concentration of 2500, you double the speed at which you move towards your (disability-adjusted) destiny. If you’re exposed to a level of x for h hours, then you lose h × (x / 2500) hours.
In practice, this isn’t too different from the previous estimate since life expectancies don’t vary that much between countries.
Personal exposure
So, we can estimate how much harm particulates do. Your next question should be, how many particles are you exposed to? Probably the answer is ambient levels plus some extra that’s created indoors, but it’s hard to say how large that extra amount is.
Where people spend their time
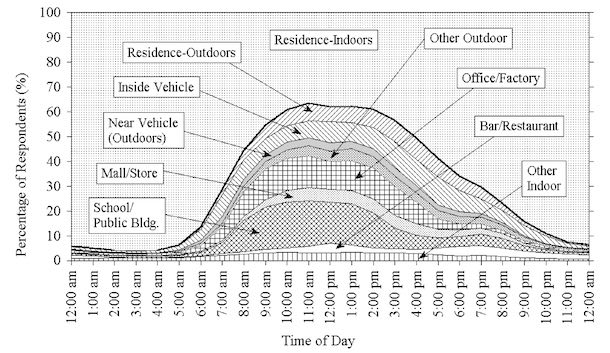
There are great records of outdoor levels, but people aren’t outdoors very much. Here’s the NHAPS survey on how Americans spent their time from 1992 to 1994.
No recent survey seems to equal this. They even have curves of where people are throughout the day.
Personal vs. outdoor exposure
Are levels indoors the same as outdoors? There’s a strong correlation—particularly if people keep their windows open—but it varies. Typically, levels indoors are higher than outdoors. Chen and Zhao review a bunch of papers that try to estimate the indoor/outdoor (I/O) ratio:
None of this really matters though. Indoor levels vary in space. What you care about is your personal exposure—the air that actually goes into your lungs.
This is hard to study since someone has to carry a measurement device on their person. Still, it’s been done a few times. Early attempts put a small tube near the mouth that passed that air through a filter that was later weighed. More recent studies use devices that measure light scatter.
I couldn’t find any good reviews, so I did my own. Here’s a comparison of the mean personal and outdoor levels in all the studies I found:
You can expand a table with details on all the studies here.
Here’s all the studies I found that try to compare mean personal (P) exposure to indoor (I) or outdoor (O) exposure.
| Study | Where | I | O | P | |
|---|---|---|---|---|---|
| Williams 2003 | North Carolina | 19.1 | 19.3 | 23.0 | |
| Meng 2005 | Los Angeles | 16.2 | 19.2 | 29.3 | |
| Elizabeth, New Jersey | 20.1 | 20.4 | 46.9 | ||
| Houston | 17.1 | 14.7 | 37.2 | ||
| Koutrakis 2005 | Baltimore | 20.1 | 15.1 | seniors, winter | |
| Baltimore | 23.2 | 18.6 | children, summer | ||
| Boston | 11.6 | 14.1 | seniors, winter | ||
| Boston | 17.0 | 30.3 | children, summer | ||
| Sørensen 2005 | Copenhagen | 13.4 | 9.2 | 17.5 | < 8C (median exposure) |
| Copenhagen | 9.5 | 7.8 | 11.9 | > 8C (median exposure) | |
| Johannesson 2007 | Gothenburg, Sweden | 9.7 | 7.8 | 11.0 | |
| Suh 2010 | Atlanta | 17.17 | 15.78 | ||
| Lei 2016 | Shanghai | 94.5 | 110 | ||
| Chen 2018 | Hong Kong | 35.3 | 35.4 | 88% had windows open | |
| Sanchez 2019 | Villages near Hyderabad | 34.1 | 58.5 | Women (half cooked with biofuels) | |
| Villages near Hyderabad | 31.9 | 55.1 | Men |
Personal exposure is strongly correlated with outdoor levels, but typically a bit higher. If you trust the trendline, it predicts that someone with an outdoor level of 50 would have a personal exposure of 62.5.
However, personal exposure is much less predictable than the graph above would suggest. Each point is averaged over many people. Individual studies that broke things down person by person show a huge range.
So, your exposure is probably ambient levels plus some amount that depends on what you do and where you go. To figure that out, we’ll have to dig deeper.
Particles Outdoors
Most particles are introduced by human activity. Common sources are power plants (particularly coal, but also natural gas and oil), factories, human-made fires, cars, and trucks. Natural sources are dust, wildfires, and (oddly) sea spray.
Variance with respect to city/region- Large: Levels vary hugely throughout the world. Estimates vary, but some countries are really low (New Zealand, Canada) and some are an order of magnitude higher (India, Qatar). Different locations inside of countries are correlated partly because of the same air blowing around and partly because of shared emissions controls. Still, if your city has no wind and lots of factories and cars, levels will be higher.
Variance with respect to location within a city/region- Smallish: How much variability is there between different places in the same city? The answer seems to be some. A massive study in various locations in Europe addressed found that particle levels near streets were around 20% higher than urban measurements which were, in turn, around 20% higher than regional measurements.
Variance with respect to date- Moderate: At the same location, levels vary throughout the year. Here’s the mean concentration in Los Angeles for every day for 20 years, courtesy of the EPA.

You can see the impact of people blowing up fireworks to celebrate their freedom (July 4 every year), everyone staying at home because of a pandemic (March-April 2020), and massive nearby wildfires (September 2020).
Incidentally, how much did those wildfires matter? Many areas saw their levels rise to around 100 for a few weeks and some spiked as high as 200-500. As a pessimistic estimate, suppose your levels rose by 200 for a full month. That raises your yearly average by 16.67, which would cost ½ a DALY if it happened every year. If it just happened once, you’d lose 200/2500=.08 months or 2.4 adjusted life days.
Variance with respect to time of day- Smallish: At the same location and date, levels change by the hour. Manning (2018) combined measurements from 3110 sites around the world to get the following graph.
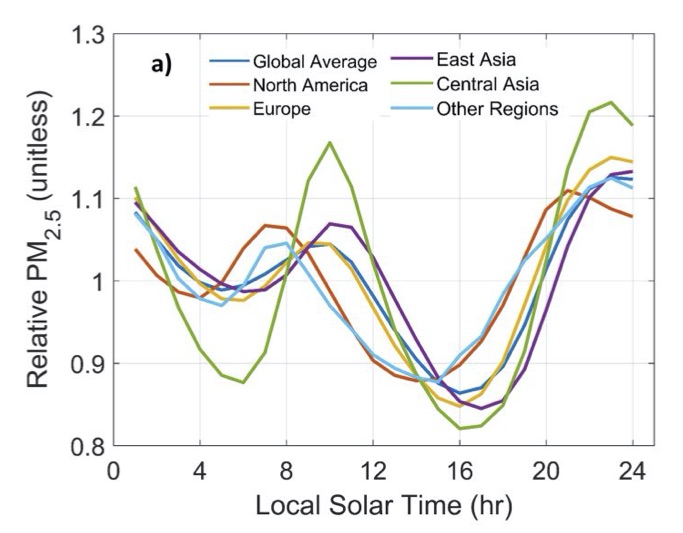
Here, we have a great riddle: Why are levels lowest in the mid to late afternoon? They suggest that “this remarkable global homogeneity in diurnal PM2.5 cycles suggests the influence of common factors including the diurnal cycle of mixed layer depth modulated by other processes such as diurnally varying emission patterns.”
What I think this means is this: The sun heats up the earth in the morning. This causes the air near the earth to rise, mixing up the different layers of air. This pulls lots of particles from close to the ground up into the sky, decreasing the density. After the earth cools, the air stops mixing around so much. Also, maybe it has something to do with when people commute and so on.
I’m fascinated by this phenomenon of mixed layer depth but haven’t been able to figure out much about it. Does it change throughout the seasons? Is that why wintertime air quality is often worse? I don’t know.
Particles While Commuting
Driving: Cars generate lots of particles. If you’re driving near lots of other cars particle levels are probably higher than the overall ambient air. A couple of studies I saw found levels in the range of 50-100 in cars. Others suggest it’s a not so bad and similar to just being outside. It probably depends on your car, traffic, local emissions controls, and weather.
Walking, biking, and running: If you’re on a street, your exposure is maybe a bit higher than the background, but not a ton. As mentioned above, street measurements are typically a bit higher than urban measurements. If you’re biking or running, you’re breathing harder. It seems that a typical adult breathes around 15 times per minute but can speed up by a factor of 4 if exercising hard. This might mean that particles accumulate 4 times as fast, but I can’t find any clear evidence.
We could estimate the harms from pollution as a result of running or biking, but I won’t since exercise also improves cardiovascular health, and I don’t know how to calculate the tradeoff.
Riding the subway: Luglio (2020) measured particles for all the major train systems in the northeastern United States. Levels in aboveground stations were always low (10-25).
| City | On Trains | Underground stations |
|---|---|---|
| Boston | 182 | 327 |
| New Jersey to New York (PATH trains) | 449 | 779 |
| New York (MTA trains) | 343 | 547 |
| New York to Long Island (LIRR trains) | 11.6 | 91.2 |
| Philadelphia | 55.7 | 112 |
| Washington DC | 205 | 362 |
For the worst-offending train system, taking a single trip from Newark, New Jersey to the World Trade Center in New York should cost 7.5 life minutes. Doing that as a commute five days per week would cost 0.56 DALYs.
The trip takes 25 minutes. Suppose you spend a combined 10 minutes in the two stations. Your exposure for the hour you do that trip is 779×10/60 + 449×25/60 = 316.9, leading to a cost of 316.9/2500=.126 hours.
There are 10 total trips, each raising your exposure by 316.9 for one hour. This raises your average weekly exposure by 316.9×10/(7×24)=18.86 with a cost 18.86/33.33 = 0.56 DALY.
Smith (2020) found that in the London underground, the Victoria line had a median level of 361, the Northern line 194, a couple other around 50, and the rest even lower. The Victoria line is highest because it is entirely underground, meaning that particles have nowhere to go.
Martins (2015) reviews many previous studies and found levels over 100 in London, Buenos Aires, Paris, Beijing, New York, Stockholm, Shanghai, Barcelona, and Seoul. There were lower levels in Budapest, Guangzhou, Helsinki, Los Angeles, Mexico City, Taipei, and Sydney.
Rant: Let’s face it, these levels are a scandal. Some places are working on it, but progress is slow because it’s hard to retrofit trains. Hear me, transit agencies: Don’t retrofit the damn trains. Just install normal air purifiers in stations. Do this because:
- The problem is that particles build up slowly in tunnels with no place to escape. We can solve the problem at the source by slowly removing particles.
- It’s easy to put static purifiers in stations. Space and power aren’t as much an issue. You can use standard components.
- The particles in trains are coming from the stations and tunnels.
- People also breathe the air in stations.
Are air purifiers too expensive? Well, the New York subway (MTA) has 275 underground stations. Assume pessimistically that each station needs 50 purifiers, and it costs $1000 each per year to operate them. (The MTA is fond of vastly overpaying.) The cost would be 13.75 million per year, less than 0.1% of the MTA’s budget. Seems worth it to avoid exposing millions of people to air five times more hazardous than the most polluted cities in the world.
Particles Indoors
Suppose you’re inside your home. The quality of the air you breathe can be reduced to five factors:
- Particle levels outdoors.
- How long particles hang in the air indoors.
- The exchange rate between indoor and outdoor air.
- Stuff you do that creates particles indoors (cooking, candles).
- Stuff you do to remove particles indoors (running a purifier).
We’ve covered #1 already. Let’s do the rest.
How long particles hang in the air
Maybe indoor air is somehow automatically cleaner than outdoor air? Public health guidance to stay indoors during poor air quality suggests this.
Left alone, particles do settle out of the air. With totally still air, this happens deterministically with larger particles falling faster. With real (turbulent) air, particles bounce around until they stick to a surface. This leads to an exponential decay with a rate depending on the particle size and air turbulence. Experiments suggest something like the following:
| Particle size | half-life with stirred air |
|---|---|
| 10 μm (largest PM10) | 2 minutes |
| 2.4 μm (largest PM2.5) | 3 hours |
| 1 μm | 1 day |
| .1 μm | 1 month |
| .01 μm | 1 year |
I have trouble determining how much these times depend on air turbulence or if the stirring rate resembles real-world conditions.
Half-lives of air in homes
Even with all windows closed, air is constantly moving through cracks in the building. Let’s quantify this as a “ventilation half-life”, the amount of time after which half of indoor air has been replaced from outdoors. In typical homes this seems to range from around 1 to 5 hours. It’s longer in more energy-efficient homes and (much) shorter if windows are open.
It's more common (and more confusing) to use something called an "air exchange rate".
If you search for “air exchange rate” you’ll mostly see definitions like “number of air changes per hour”. This obviously doesn’t make any sense – there aren’t discrete changes. If you search very hard, you can find that the air exchange rate is the constant a such that after time t, a fraction of exp( - a t) of the initial air is remaining. We can solve this for 1/2 to get that the half-life is t=ln(2)/a=0.693/a.
In summary, unless you actively clean the air, indoor levels are probably similar to outdoor levels plus whatever particles you generate inside. The air is exchanging fast enough that by the time particles have fallen out of the air, new particles have come from outside. (However, closed windows should work for larger particles and there might be some benefit to opening/closing your windows based on changing outdoor levels.)
Exposure with decaying concentrations
To calculate the impact of specific things that generate particles, we’ll need a quick calculation. If you generate a puff of smoke with a peak concentration of c and a half-life of h, levels will fall off slowly over time. What’s your total exposure?
The following graph shows a peak concentration of c=1000 that decays with a half-life of h=0.2 hours. This turns out to be equivalent (same area-under-the curve) to being exposed to a constant of 288 for 1 hour.
Where did 288 come from? The general formula is 1.44 × c × h. This is natural enough: It’s the peak concentration times the half-life times an extra constant because of math. As you’d expect, doubling the peak concentration or half-life doubles the total exposure.
The general formula comes from a simple integral.
After an amount of time t particles have undergone t/h half-lives, meaning the total concentration will have decayed by a factor of (1/2)^(t/h), and so the current level is at time t is c×(1/2)^(t/h). If we integrate this to get the total exposure, it is ∫c×(1/2)^(-t/h) dt = c × h/ln(2). It happens that 1/ln(2)≈1.44.
Things that create particles indoors
Smoking: Have you heard? Smoking is bad for you. Shaw (2000) estimates that one cigarette reduces (non disability-adjusted) life expectancy by 11 minutes, and helpfully points out that this is enough time for “fairly frantic sexual intercourse”. Let’s move on.
Vaping: The following is entirely about second-hand vape smoke. (I advise against vaping unless you’re doing it to quit smoking.)
It sometimes feels like the public health community is hellbent on destroying vaping, damn the evidence. Sure, I always thought, vaping isn’t great, but surely the harm is small?
The vaping community often points to this report from the CDC, which didn’t find any problems. However, they didn’t check for particles. This proves nothing.
Lots of people have measured particles near vaping and found high levels. Soule (2017) found levels around 1000 at an e-cigarette conference. Li (2021) found an average level of 276 in six vape shops in Southern California. Protano (2020) found that a single person vaping could create levels as high as 1000-10,000. Lots of random people measure particles and report numbers like 600 or 546 or 1000. Some report that their parents made them do this (good job, parents.)
Vaping enthusiasts retort that the particles are almost all water and glycerol plus a tiny amount of nicotine. This appears to be true – unlike tobacco smoke, exhaled vape air doesn’t contain significantly more phenols or carbonyls (like formaldehyde or acetone) than regular exhaled air.
I’m tentatively calling this for Team Vape. In the mountains of papers measuring high particles from vape smoke, few even acknowledge the claim that it’s all water and glycerol. Maybe I’m missing something? My idea of an anti-vaping conspiracy has not receded.
Fireplaces and solid fuels: Various papers have found that a typical day living as an 18th century farmer or being a Viking or cooking over an open fire in Guatemala could all lead to average daily particle concentrations around 200. These studies always find insane particle levels near the fire (in the thousands), but these buildings have good ventilation and people don’t spend that much time near the worst smoke. This would suggest a loss of around 6 DALYs, though real Vikings might have created less smoke after generations of practice at tending fires.
Still today, there are many people throughout the world who cook indoors with solid fuels (coal/wood). In India, including the harms from household air particulates nearly doubles the (already large) losses that ambient air pollution causes.
How much could it hurt you to have a fire in a fireplace? This depends on many factors: How big is the fire? Is it burning well? How well-ventilated is your home? Do you have a glass panel in front of the fire? How well does the flue for the fireplace draw air?
Let’s be really pessimistic and imagine that you have a fire that produces a concentration of 25,000 and that this lasts for five hours. This would cost you around 50 disability adjusted life hours. Doing everything right can probably reduce this by 2-3 orders of magnitude. A modern wood stove with tight seals could do even better.
Cooking: What about other types of cooking? Again, it all depends. Kang (2019) tried cooking various things in 30 different buildings in Korea. On average, soup produced a peak concentration of 65, frying 424, and broiling 1256. Both frying and broiling were hugely variable.
Opening a window reduced the peak concentration to around ⅓ as much. Using a range hood (with or without an open window) reduced it to around ⅐ as much.
And how long do the particles stick around? With no range hood or ventilation, they found a mean half-life of around an hour. (That’s actually on the faster end of the ventilation half-lives we talked about above.) With a range hood, the half-life was around 20 minutes. With open windows, it was around 6-7 minutes (regardless of the range hood).
These numbers suggest broiling fish with the windows closed leads to a total loss of around 45 minutes.
Candles: Candles produce some particles while burning, but the vast majority of their particles happen in an instant when the candle is extinguished. (This is confirmed by other research.) Blowing out a candle causes a spike to around 50-200 with particles hang in the air for 3-5 hours.
Assuming average values, blowing out a candle costs 10 minutes. Doing it every day of your life costs 0.5 years.
Take a spike of 100 and assume that the particles hang in the air for 4 hours. Then the cost is 100 × 4 / 2500 = 0.16 hours or 9.6 minutes.The obvious solution is to avoid candles. If that’s a nonstarter for you, candles probably aren’t that bad, just don’t blow them out. Instead, extinguish them with an airtight lid.
Incense: One paper suggests that burning an incense stick could produce a peak concentration of around 800, while a cone might produce a peak concentration of over 4000, with a half-life of around 1.6 hours.
This suggests burning a cone of incense costs 3.68 hours.
Using our half-life formula, the total exposure is 4000 × 1.6 × 1.44 = 9216 particle hours. Thus, the total cost is 9216 / 2500 = 3.68 disability adjusted hours.Don’t use incense.
Aerosols: Some cleaning products create a ton of particles. One paper found that using Febreze caused particles to spike by 50-75, They also found that hairspray could cause a spike of up to 200, with a half-life of 2 hours. These also seem to be exceptionally small particles that hang in the air for a very long time.
This suggests that using hairspray (indoors) has a cost of around 14 minutes.
Assume an increase of 200 and a half-life of 2 hours. Then, the total cost is 200 × 2 × 1.44 / 2500 = .23 hours.Try to avoid spraying anything into the air. If you really love hairspray, you could use it outside, or in a well-ventilated room right before leaving.
Humidifiers: You’re not going to like this, but ultrasonic humidifiers produce huge numbers of particles. They turn any minerals in the water into airborne particles. They do this almost by design! Park (2020) tested different types of water in a small chamber with a carefully controlled air exchange rate and got the following steady-state increases over background levels.
- Mineral water: ~265
- Tap water (Seoul): ~260
- Purified water: ~50
- Distilled water: ~0
This appears to show that it’s not just water particles being counted. Some real-world people report even higher numbers. I’ve tested this myself and found the same thing.
This suggests that using an ultrasonic humidifier with tap water at night for 8 hours costs 50 minutes. Doing it every night costs 2.6 years.
(Since we're looking at steady-state concentrations rather than peak, we don't consider half-lives.) Your total exposure for one night is 260 × 8 = 2080, with a cost of 2080/2500 = 0.832 hours = 50 minutes. If you do this every night, it raises your mean daily exposure by 260 × 8 / 24 = 86.66 with a cost of 86.66 / 33.33 = 2.6 years.Using a humidifier at night is almost as bad as smoking 5 cigarettes!? I was skeptical such large numbers could be real. I read the instruction manuals for a few ultrasonic humidifiers. There were a few passages suggesting they are not unaware of the issue:
-
“Use only clean, cool tap water to fill the Water Tank (filtered or distilled water is recommended to avoid white dust if tap water is too hard.)”
-
“The best way to minimize mineral build-up is to use distilled or de-mineralized water.”
-
“IMPORTANT: Using tap water with a high mineral content aka ‘hard water’ with any humidifier can cause a fine white dust to be emitted. To avoid this, use distilled or demineralized water.”
As further evidence, the EPA has a report that says, “Recent studies […] have shown that ultrasonic and impeller (or ‘cool mist’) humidifiers can disperse materials, such as microorganisms and minerals, from their water tanks into indoor air.” They recommend emptying and cleaning the tank every day as well as using distilled water.
The EPA emphasizes that there’s no proof that these particular particles harm health. That’s an… interesting… way of looking at things. It might be appropriate logic for a government contemplating a ban, but not for us. These are huge effects, and you should assume ultrasonic humidifiers are dangerous until there’s convincing evidence to the contrary.
In theory, you might try to solve the problem by using distilled water or humidifying a room during the day with the door closed. But don’t. What if the humidifier gets dirty? What if particles leak out of the room? What if you have bacteria build up and pollute your water? Are you really going to unplug, clean, and dry the humidifier every time you use it?
Just use an evaporative or steam humidifier, which seem to create almost no particles. (Edit: There was a lot of skepticism about this. So I wrote a standalone post on the dangers of ultrasonic humidifers.)
Other random things
Vacuuming has been reported to cause particles to spike by 50. Cleaning dryer lint causes a spike in PM10 but not PM2.5. You can get a small spike by making a bed!
Overall, there’s no way to avoid creating particles. Almost any activity that involves molecules will create some particles. In reality, exposure for a small amount of time isn’t a big deal. The solution is to avoid the biggest problems and make sure particles are removed from the air quickly enough to avoid major harm. You can do this by purifying the air. Or, if you’re a lucky person with clean and temperate air outside, you can just keep your windows open.
What to do
Try not to create particles indoors.
Above all, kill your ultrasonic air humidifier. Don’t burn stuff while cooking. Don’t use incense at all ever. Extinguish candles with a lid. Avoid dangerous cleaning products. If you use hairspray, I guess you could do it outside?
(Edit: It’s also better to avoid gas stoves if you can, since they create nitrogen dioxide. In another post I estimated that using a gas stove your entire life would reduce life expectancy by around 53 days.)
Monitor outdoor levels.
Most places in the world have real-time particle measurements. You should follow these along with the weather. Some weather websites/apps already include particle counts – consider using these.
Get a particle counter.
You can estimate the air exchange rate of your home and the rate your purifier removes particles. You can try to reduce activities that generate particles indoors. But the only way to be sure is to check.
You can get an OK-ish particle counter for $100. Carry it around with you sometimes to check for any nasty surprises. Share it with your friends. We really need better wearable particle counters. Ideally, these should be integrated into watches or phones.
(Lots of people have asked me for a recommended particle counter. I don’t want to recommend the one I have because it’s somewhat crap. This site has some tests that seem credible.)
Use an air purifier inside.
An air purifier in your home has two purposes:
- To reduce the steady-state level caused by outdoor particles drifting indoors.
- To reduce the half-life of particles you generate indoors.
It turns out that an air purifier reduces both of these by exactly the same fraction. To be more precise, assume
- Your ventilation half-life is t, meaning that after this amount of time, half the air in your home has been replaced with outdoor air. (Typical times might be one to five hours.)
- Your purification half-life is s, meaning that after this amount of time, your purifier removes half the particles from the air.
When you turn on the purifier, because of math, your total exposure from both indoor and outdoor sources gets multiplied by a factor of
s / (s + t).
This is intuitive: You want purification to be faster than ventilation, i.e., you want s < t. In that’s true, then your total exposure is reduced to a small fraction of what it would be without the purifier.
For example, suppose your home has an average ventilation half-life of 120 minutes and that you run a cuboid air purifier on low, meaning a purification half-life of 15 minutes in a 31 m³ room. Then that purifier reduces your exposure to a fraction of ⅑=15/(15+120) of what it would otherwise be.
While this works for both indoor and outdoor particles, remember that it always helps to open the windows if outdoor levels are currently lower than indoors — e.g., if you just burned dinner, it helps to open the windows until indoor levels equalize with outdoor levels.
Because this gets a little bit into the weeds, I'm suppressing the details of how to derive that formula here.
First let’s talk about the steady state. In a fixed amount of time, purifiers remove a fixed fraction of particles from the air, while ventilation will replace a fixed fraction of indoor air with outdoor air. Thus, the more particles, the faster purification works and the less ventilation does. The steady state is when these are equal.
If outdoor levels are L, it turns out that the steady-state for indoor levels is L × s / (s + t).
For example, suppose outdoor levels are 100, your home has an average ventilation half-life of 120 minutes and that you run a cuboid air purifier on high, in a medium room, meaning a purification half-life of 7 minutes. Then the steady-state concentration will be 5.5 = 100 × 7 / (7 + 120).
Now let’s talk about particles created indoors. Say you generate a bunch of smoke and get a peak concentration of c. If particles only go away because of ventilation, your total exposure ends up being 1.44 c t. Now suppose you have an air filter that would have a half-life of s without ventilation. The combined half-life ends up being st/(s+t), so your new exposure is 1.44 c s t / (s+t). The ratio of new and old exposure is again s/(s+t).
Put a HEPA cabin air filter in your car
One car company hypes the hell out of their air purification system. It’s great to raise awareness but… well… most cars made any time in the last 10-20 years have cabin air filters which the air goes through before being blown into your face.
These usually aren’t HEPA, but you can buy a HEPA version for like $10-$20, and easily install it yourself. For most cars you just pull out the glovebox and then slide the filter out. It takes around 5 minutes and requires absolutely no tools.
If you’re like most people, you didn’t even know you had a cabin air filter, so it’s probably time to replace it anyway. Pay the extra $5 to get one that removes small particles. (This might reduce the air velocity a little.)
Masks are really tricky
In some parts of the world, it’s common to wear masks to reduce the impact of particles. How much is this helping? I don’t think anyone really knows. Still, we can make a few conclusive statements:
-
It is possible to use a mask to eliminate the majority of particle exposure (>90 % reduction).
-
Many widely sold masks simply don’t perform as advertised, regardless of how they are used.
-
To use a mask successfully, it’s paramount to have one that fits your face and to check the fit.
In laboratory tests, researchers buy a bunch of n95 masks, and then carefully attach them to either dummies or real human heads, and then check how well they work. Optimistically, Shakya (2016) found two n95 masks both worked well, and even cloth masks did something. Richard Saint Cyr tried a bunch of masks in China while being very careful about fit and got numbers between 56% and 99%. Some papers (Cherrie, 2018; Pacitto, 2019) tested a bunch of different masks and found that one or two perform well but the majority achieve remove half of particles or less. Dismally, Faridi 2020 tried 50 different masks available in Iran and found that none did better than 40% and most were much worse.
My guess is that real-world conditions are closer to the bad cases than to the good ones.
What can you do? Two things:
-
Refuse to buy any mask without an independent test to prove it works.
-
Obsessively fit-test– a low-quality check is to look at what happens when you inhale or exhale – is it going around the sides of the mask? But really you want a formal fit test.
A common method for “real” fit-tests is to create an aerosol with saccharin (yes, the artificial sweetener) and check if the mask blocks the smell. Provenzano (2020) gives some preliminary evidence that you can do this at a low cost.
There’s no proven DIY recipe for this yet, but it seems possible. Maybe we can use those damn ultrasonic humidifiers to make the saccharin aerosol. Who knows, maybe some unrelated reason to be interested in masks might come up.


